Launching a new employee merchandise program means making inventory commitments before you have any merchandise demand forecasting data to work from, and the cost of getting it wrong runs in both directions. Order too little, and you’re delaying new hire onboarding kits, scrambling for stock, and creating a poor first impression. Order too much, and you’re absorbing sunk inventory costs that finance will remember. According to a 2023 report by the Chartered Institute of Procurement & Supply, inventory miscalculation is among the top five causes of preventable operational cost in mid-to-large organizations. The good news: a structured forecasting framework can turn a data-free launch into a defensible, scalable program. No guesswork required.
Why New Programs Have No Historical Baseline

Most organizations face this challenge in one of four scenarios:
- New onboarding kit programs launching for the first time
- Rebrands that require retiring existing inventory and starting fresh
- Workforce acquisitions that introduce an entirely new employee population with unknown size distributions and preferences
- Employee stores expanding into new product categories
In all four cases, there’s no order history to reference. That forces program owners to make forward-looking estimates, which is exactly what a structured framework is designed to do.
The stakes are higher than they appear. According to Gallup’s State of the Global Workplace report, employees who feel recognized are 27% more likely to report high engagement. A merchandise program done well is a recognition vehicle. A program that fumbles on inventory: sending wrong sizes, delaying kits, or running out of stock during high-visibility onboarding moments, undermines the very outcome it was designed to create.
The Six-Step Merchandise Demand Forecasting Framework
Step 1: Anchor to Population Data

Before building any estimate, establish your employee population as the foundational input. This means capturing:
| Data Point | Why It Matters |
| Total current headcount | Sets your baseline order volume |
| Department/role breakdown | Determines segmentation logic (see Step 2) |
| Location distribution | Informs regional shipping volumes and fulfillment complexity |
| Employment type (FT, PT, contract) | Determines who receives which kit tier |
| Projected 6–12 month hiring | Prevents underordering for near-term growth |
This data typically lives across HRIS, workforce planning, and talent acquisition systems. It’s worth pulling all three rather than relying on any single source.
Step 2: Segment Employees by Role, Not Headcount

Treating every employee as interchangeable is the most common forecasting error in new merchandise programs. Different employee segments have meaningfully different merchandise needs, utilization rates, and cost justifications:
| Segment | Characteristics | Forecasting Implication |
| New hires | Highest-stakes first impression | Order at 100% participation rate; prioritize size accuracy |
| Field/frontline employees | High utilization; items wear faster | Model for replacement cycles, not just initial issue |
| Leadership / executives | Smaller population; higher-quality items | Lower quantity, higher unit cost; separate SKU tier |
| Remote employees | No in-person distribution; shipping required | Build shipping logistics cost into budget, not just inventory cost |
| Part-time / contractors | May receive reduced kit or none | Clarify inclusion criteria before modeling |
Segmenting this way also helps prioritize where accuracy matters most: a 10% sizing error on a new hire kit has a different impact than the same error on a seldom-worn executive fleece.
Step 3: Apply Industry Benchmarks as a Proxy for Historical Data

Without your own data, benchmarks are your best available proxy. Key benchmarks to apply:
Size distribution curves (apparel):
Industry standard sizing distributions for general corporate populations run approximately:
| Size | Estimated % of Population |
| XS | 3–5% |
| S | 12–15% |
| M | 25–28% |
| L | 25–28% |
| XL | 15–18% |
| 2XL | 7–10% |
| 3XL+ | 3–5% |
Note: These benchmarks shift by industry. Construction, manufacturing, and logistics workforces skew larger. Tech and professional services skew toward S–L concentration. Adjust for your population.
Program participation rates:
For mandatory onboarding kits (issued to all new hires), participation is effectively 100%. For opt-in employee stores or voluntary programs, industry participation rates typically range from 35–65% in year one, rising to 55–80% by year two as brand awareness builds.
First-year adoption patterns:
Merchandise programs typically see front-loaded demand: roughly 40–50% of annual volume arrives in the first quarter post-launch as existing employees receive initial kits. Plan your initial order and restock cadence around this curve.
Step 4: Build Three Forecast Scenarios

Single-point forecasts are structurally fragile. A more defensible approach models three scenarios:
| Scenario | Logic | Use Case |
| Conservative | 70–80% of expected participation; tighter size distribution | Budget floor; finance justification |
| Expected | Benchmark-based participation; standard size curve | Primary planning number; initial PO basis |
| Aggressive | 110–120% participation; extended size range | Ceiling estimate; identifies maximum exposure |
Your purchase order will typically fall between conservative and expected scenarios on initial launch, with a restocking plan triggered by actual consumption data in weeks 4–8.
Scenario Planning Checklist:
- [ ] Have you modeled all three scenarios against budget?
- [ ] Does your vendor have the capacity to fulfill the aggressive scenario on short notice?
- [ ] Is your conservative scenario still sufficient to cover mandatory new hire kits?
- [ ] Have you shared all three scenarios with finance and HR stakeholders?
Step 5: Build in a Growth Buffer
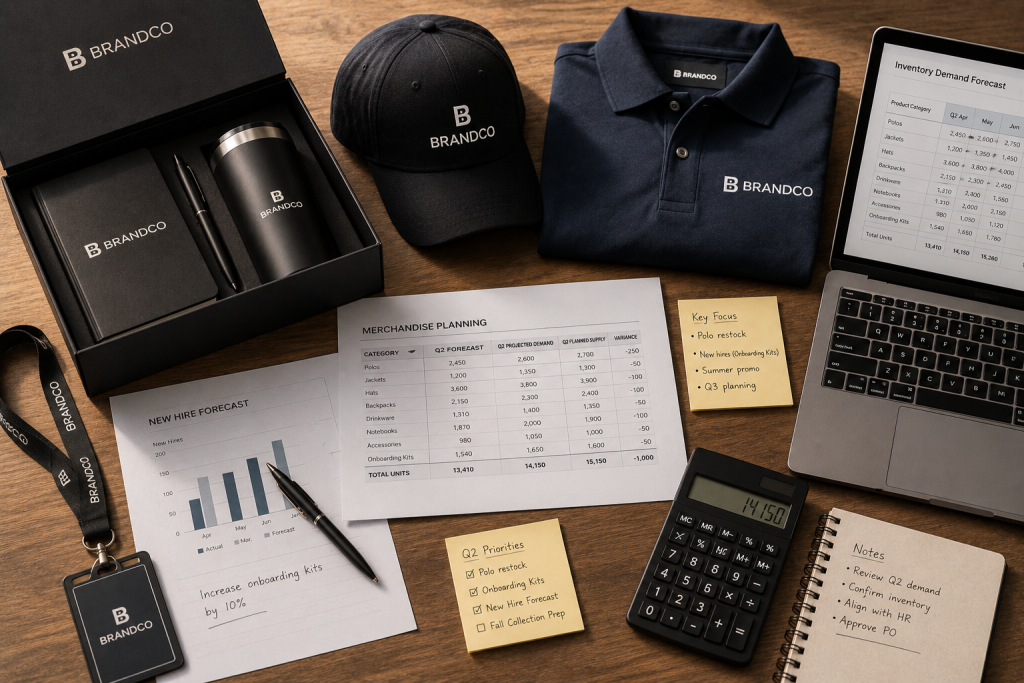
A common mistake is forecasting only for the current headcount snapshot. Employee merchandise programs typically run on 6–12 month inventory cycles, and headcount rarely holds static. Model for:
- Planned hiring from workforce plans (request this from talent acquisition)
- Acquisition activity if your organization has an active M&A pipeline
- New office openings or geographic expansion
- Program expansion (e.g., adding a new SKU or extending the program to contractors)
A practical rule of thumb: add 15–20% to your expected scenario as a forward-looking growth buffer. If your expected scenario yields 1,000 units, plan to order 1,150–1,200. The incremental carrying cost is almost always lower than the cost of a stockout during a high-visibility moment.
Step 6: Calculate Safety Stock Per SKU

Safety stock is your buffer against variables you can’t forecast: usage spikes, supply chain delays, vendor lead time variability, and sizing surprises. Unlike growth buffer (which accounts for demand expansion), safety stock accounts for demand volatility.
Safety Stock Formula:
Safety Stock = (Maximum Daily Usage × Maximum Lead Time) − (Average Daily Usage × Average Lead Time)
For most employee merchandise programs, a simpler heuristic is sufficient for initial planning:
| Program Type | Recommended Safety Stock |
| Mandatory onboarding kit (high volume) | 15–20% per SKU |
| Opt-in employee store (moderate volume) | 10–15% per SKU |
| Executive / leadership tier (low volume) | 25–30% per SKU (low base makes stockouts acute) |
Why this matters: Restocking lead times for branded merchandise typically run 4–8 weeks, depending on whether items are on-demand or require custom decoration. A stockout on a new hire’s start date has immediate culture and engagement consequences. The carrying cost of safety stock is almost always the cheaper outcome.
Making Your Second Order Smarter Than Your First

The real payoff of a structured first-order framework is that it creates a measurement baseline. After 60–90 days of program operation, you should be able to capture:
- Actual vs. forecast participation rate by segment
- Size distribution actuals vs. benchmark assumptions
- Consumption velocity per SKU
- Stockout incidents and the segments they affected
- Overstock positions by size and item category
Each data point makes your second forecast meaningfully more accurate. Organizations that build measurement into their first cycle from day one close the gap between benchmark-based and data-driven forecasting within two cycles.

FAQ: Merchandise Demand Forecasting for Employee Programs
Q: How do I forecast merchandise for a newly acquired workforce?
Start with the acquired company’s headcount data segmented by role and location. Apply standard size distribution benchmarks as your baseline, then adjust upward or downward based on any industry-specific size skew (e.g., if acquiring a field services company, shift your distribution toward L–3XL). Plan for a higher-than-normal initial order since acquired employees often have no existing branded merchandise.
Q: What participation rate should I assume for a new employee store?
Industry benchmarks suggest 35–65% participation in year one for opt-in programs. Conservative planning assumptions should use 35–40%; expected scenario planning should use 50–55%. Avoid assuming 100% participation unless the program is mandatory.
Q: How much safety stock should I carry for branded apparel?
For high-volume mandatory programs, 15–20% per SKU is a reasonable starting point. For low-volume executive tiers or specialty items, carry 25–30% because restocking even small quantities takes time and stockouts are disproportionately visible.
Q: What’s the biggest forecasting mistake companies make on their first merchandise order?
Treating all employees as the same. New hires, field employees, remote workers, and leadership all have different utilization rates, kit contents, and size distributions. Segmenting before you forecast prevents both underordering for high-need groups and overordering for low-utilization ones.
Q: How long does it take to get from benchmark-based to data-driven forecasting?
Most programs can generate meaningful actuals-vs-forecast data within 60–90 days of launch. Two full ordering cycles, typically 12–18 months, is usually enough to replace benchmark assumptions with organization-specific data across most dimensions.
Q: How do I justify my merchandise forecast to finance with no historical data?
Present all three scenarios (conservative, expected, aggressive) with the logic behind each. Tie the expected scenario to population data and named benchmarks. Show the cost differential between a stockout (delayed onboarding, employee experience impact) and carrying excess inventory. Finance is more comfortable with a range built on logic than a single number built on intuition.
IDX partners with HR and marketing teams to design merchandise programs that reduce risk, streamline fulfillment, and scale. [Learn more about how IDX works.]