Introduction
Figuring out how much merchandise to order for a trade show is one of the most consistently underestimated challenges in event marketing. Order too little, and you’re out of product by noon on day one. Leaving your booth bare and your team empty-handed during peak traffic. Order too much, and you’re shipping 400 tote bags back to a warehouse, absorbing cost and storage fees on items that never found an audience.
Most marketers default to intuition: “We had about 500 people last year, so let’s order 500 units.” But intuition doesn’t account for VIP tiers, day-over-day traffic patterns, reserve needs, or the very real possibility that this year’s show draws 30% more foot traffic than last year’s. So, what you need isn’t a guess—it’s a framework.
Below, this article provides exactly that.
Why Merchandise Forecasting Fails
Before building a better model, it’s worth understanding why most event merchandise planning goes wrong. The mistakes aren’t random. Instead, they follow predictable patterns, and they’re correctable once you know what to look for.

Mistake 1: Using Registration Numbers as a Proxy for Booth Traffic
Total event registration and actual booth visits are not the same number—not even close. Industry benchmarks suggest exhibitors typically engage somewhere between 10% and 30% of total event attendees, depending on booth size, location, and category relevance. As a result, an exhibitor who sees 5,000 registered attendees and orders accordingly will almost always over-order broadly and under-order for the moments that matter.
Mistake 2: Ignoring Distribution Shape
Traffic isn’t evenly spread across show days. Opening days (especially the windows immediately following a keynote), can generate 40–60% of total booth traffic. That concentration means merchandise can run out on day one while excess sits untouched on day three. In other words, a forecast that doesn’t account for daily traffic shape isn’t a forecast; it’s an average masquerading as a plan.
Mistake 3: Forgetting Non-Floor Distribution
The show floor isn’t the only place your inventory goes. Sales follow-ups, internal stakeholders, VIP gift bags, and executive meetings all consume merchandise that was mentally allocated to booth visitors. Because of this, failing to build a separate allocation for off-floor distribution is one of the most consistent causes of day-two shortages—and one of the easiest to fix in advance.
Mistake 4: Misreading Attendee Intent
Not all trade show audiences behave the same way, and applying the wrong distribution model to the wrong audience is a quiet but costly mistake. At some shows (World of Concrete is a strong example), attendees are actively hunting for vendors, and giveaways are a direct driver of foot traffic. Quantity and accessibility matter here. At others, like the International Builders’ Show, the audience is more selective: they’re drawn to compelling booth experiences first, and merchandise functions as a quality signal rather than a traffic mechanism. Ultimately, the right items, presented well, outperform a table stacked with giveaways. Misreading which dynamic you’re walking into leads to either chronic shortages or a surplus of items that never earned their moment.
A strong forecasting model accounts for all four of these mistakes. The sections that follow show you how to build one—even when you’re starting from zero.
The IDX Merchandise Forecasting Framework
Step 1 — Establish Your Baseline Attendance Estimate
If you have historical data, start there. Otherwise, use the following benchmarks to build a defensible estimate.
To begin, gather these starting inputs:
- Total registered attendees for the event (available from the show organizer)
- Your booth size and floor position (corner, island, inline, or perimeter)
- Your brand’s relevance to the show’s core audience
Booth traffic conversion benchmarks by booth type:
| Booth Type | Estimated % of Total Attendees Reached |
|---|---|
| Small inline (10×10) | 5–10% |
| Standard inline (10×20) | 10–15% |
| Corner or peninsula | 15–20% |
| Island or large custom | 20–35% |
| Anchor/headline sponsor | 30–50% |
For example, a 10×20 inline booth at a show with 5,000 registered attendees should expect to engage roughly 500–750 unique visitors across the full event.
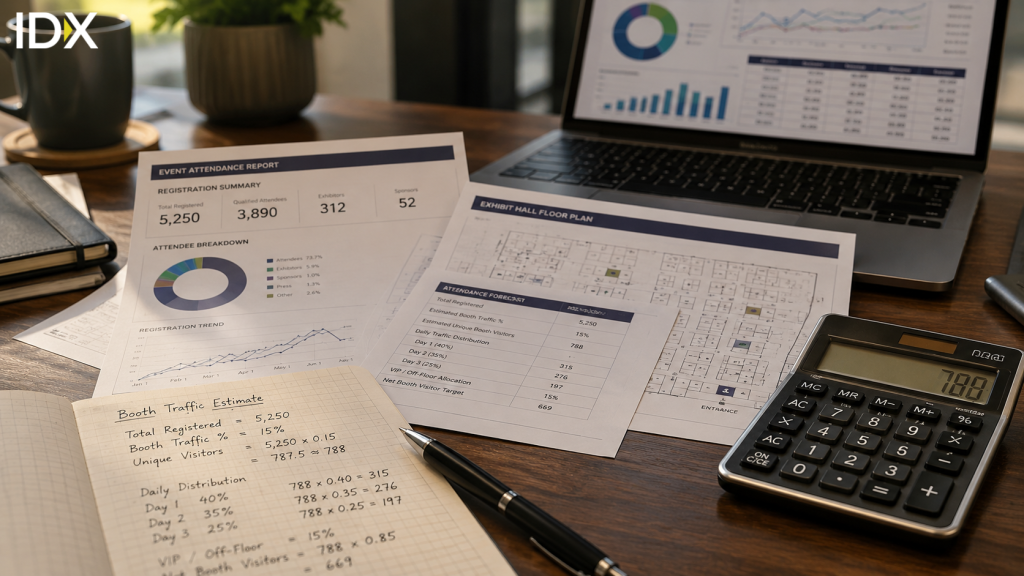
So, if this is your first time at a show, use the midpoint of the applicable range, then plan to refine it after the event.
Step 2 — Build Your Distribution Tiers
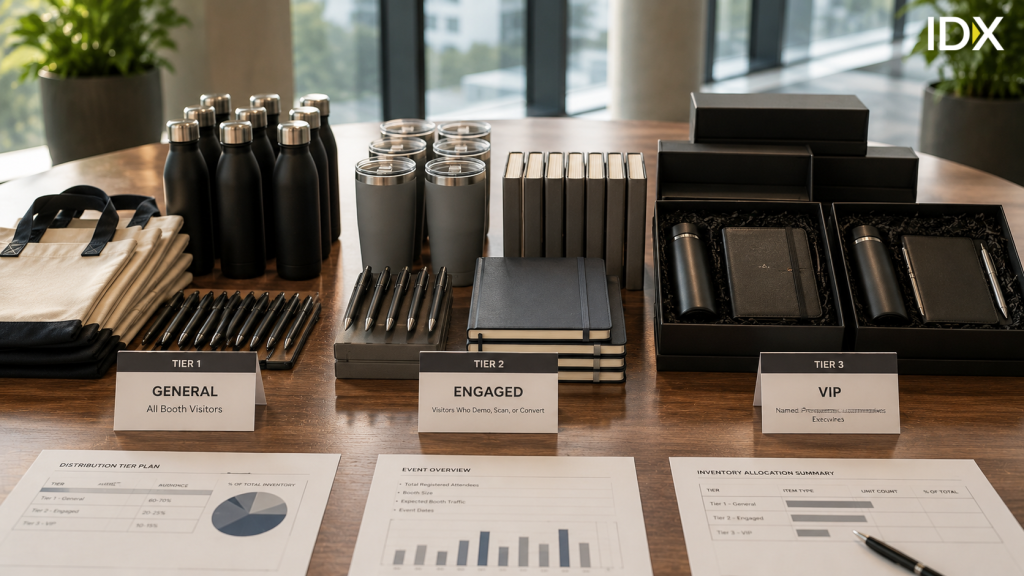
Not all merchandise should be distributed the same way. Instead, a tiered approach ensures your best items reach your most important audiences.
Three-tier distribution model:
| Tier | Audience | Item Type | % of Total Inventory |
|---|---|---|---|
| Tier 1 — General | All booth visitors | High-volume, moderate-cost item | 60–70% |
| Tier 2 — Engaged | Visitors who demo, scan, or convert | Mid-tier, higher-perceived-value item | 20–25% |
| Tier 3 — VIP | Named prospects, customers, executives | Premium or exclusive item | 10–15% |
Essentially, this model does two things simultaneously: it ensures you don’t burn through premium inventory on early, low-intent visitors, and it creates a natural incentive structure that rewards deeper engagement with your team.
Tier 3 (VIP) planning note: VIP inventory should be calculated separately from your general pool, based on a specific named list—not a percentage guess. To build this list, work with your sales team 3–4 weeks before the show. Typically, VIP list sizes run 25–75 people for mid-size shows and 75–150 for large national events.
Step 3 — Apply the Day-Weight Model
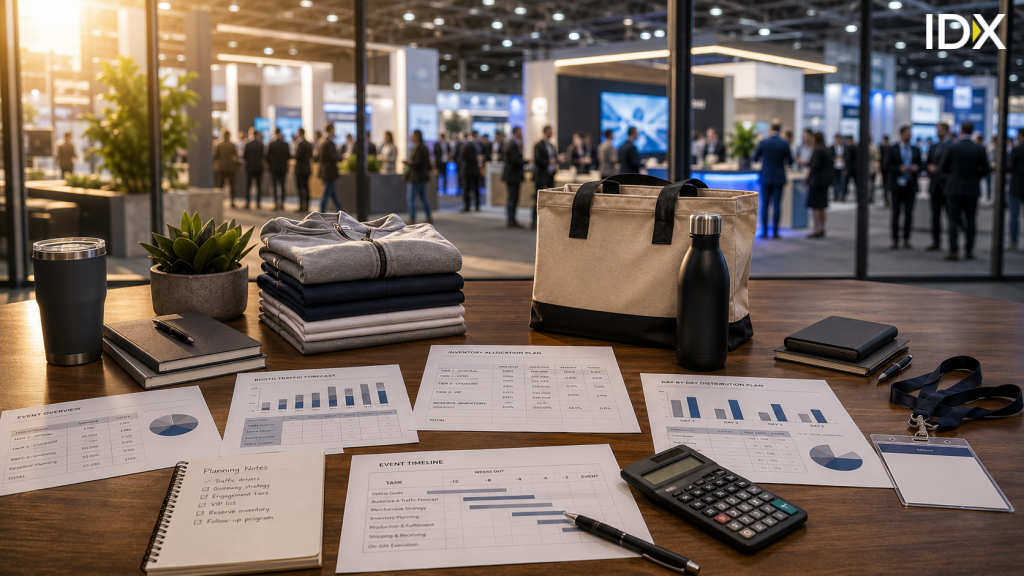
Traffic isn’t evenly distributed, and your inventory should reflect that. Use this day-weight model as a starting point, then adjust based on your specific event’s format.
Typical traffic distribution by show day:
| Show Day | Estimated % of Total Booth Traffic |
|---|---|
| Day 1 (opening + post-keynote) | 40–50% |
| Day 2 (peak engagement) | 30–35% |
| Day 3+ (wind-down) | 15–25% |
Why this matters for ordering: if you’re at a three-day show and bring exactly the number of units you expect to need, you will likely run out on day one or early day two. Therefore, the day-weight model tells you to front-load your inventory planning, not spread it evenly.
It also tells you where not to over-invest. For instance, ordering a large reserve to cover day three traffic on a show that historically winds down by mid-afternoon of day two is a waste. Before you build your buffer, take the time to understand the show’s rhythm.
Step 4 — Calculate Your Reserve Inventory
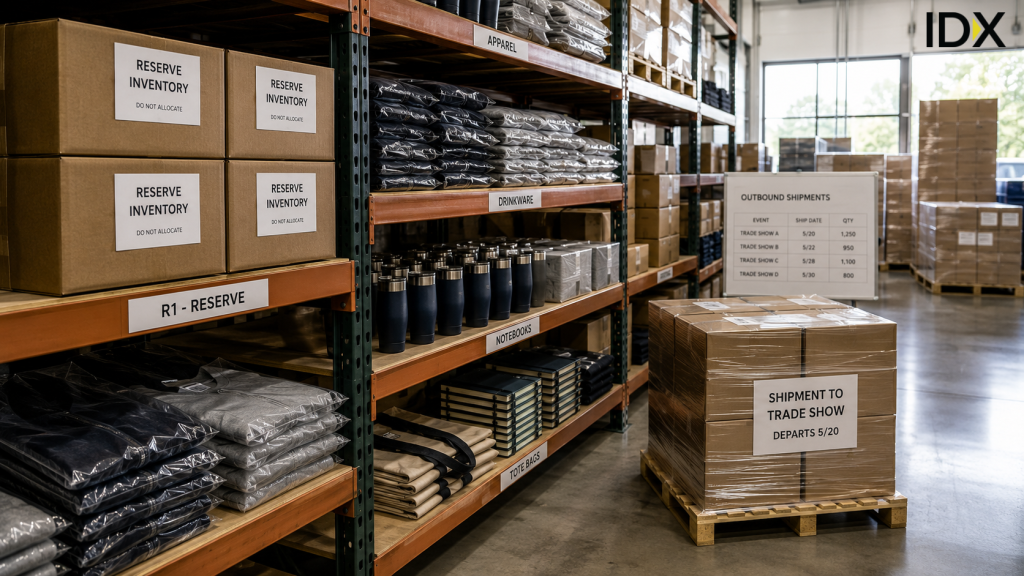
This layer of inventory serves three purposes: absorbing unexpected traffic spikes, covering non-booth distribution needs, and providing a buffer against damage, loss, or shipping errors.
Use the following formula to calculate it:
Reserve = (Total Planned Distribution × 0.15) + VIP Buffer + Non-Booth Needs
Breaking this down:
- 15% overage buffer on general and engaged-tier distribution covers unexpected traffic and shipping/damage loss.
- VIP buffer—add 10–20% above your named VIP list to account for walk-in executive conversations and last-minute stakeholder additions.
- Non-booth needs—explicitly budget for sales follow-up kits, internal stakeholder gifts, and executive hospitality events. These are frequently forgotten until the week before the show.
Non-booth distribution categories to account for:
- [ ] Post-show sales follow-up packages (estimate: 10–20% of qualified leads)
- [ ] Internal team members attending the show (often overlooked)
- [ ] Press kits or influencer outreach
- [ ] Executive hospitality suites or dinners
- [ ] Overflow for adjacent events or customer visits near the show dates
Step 5 — Run the Full Calculation
Once you have all your inputs in hand, the final order quantity becomes straightforward to calculate.
Full Forecasting Formula:
Total Order = (Estimated Booth Visitors × Tier Distribution %) + VIP Inventory + Non-Booth Allocation + Reserve Buffer
Worked example—10×20 booth, 5,000-attendee show:
| Line Item | Calculation | Units |
|---|---|---|
| Estimated booth visitors | 5,000 × 12% | 600 |
| Tier 1 general items | 600 × 65% | 390 |
| Tier 2 engaged items | 600 × 25% | 150 |
| Tier 3 VIP items | Named list + 15% buffer | 65 |
| Non-booth allocation | Sales follow-up + internal | 80 |
| Reserve buffer (15%) | (390 + 150) × 15% | 81 |
| Total Tier 1 order | 390 + 81 + 80 | 551 |
| Total Tier 2 order | 150 + buffer | 175 |
| Total Tier 3 order | Named VIP list + buffer | 65 |
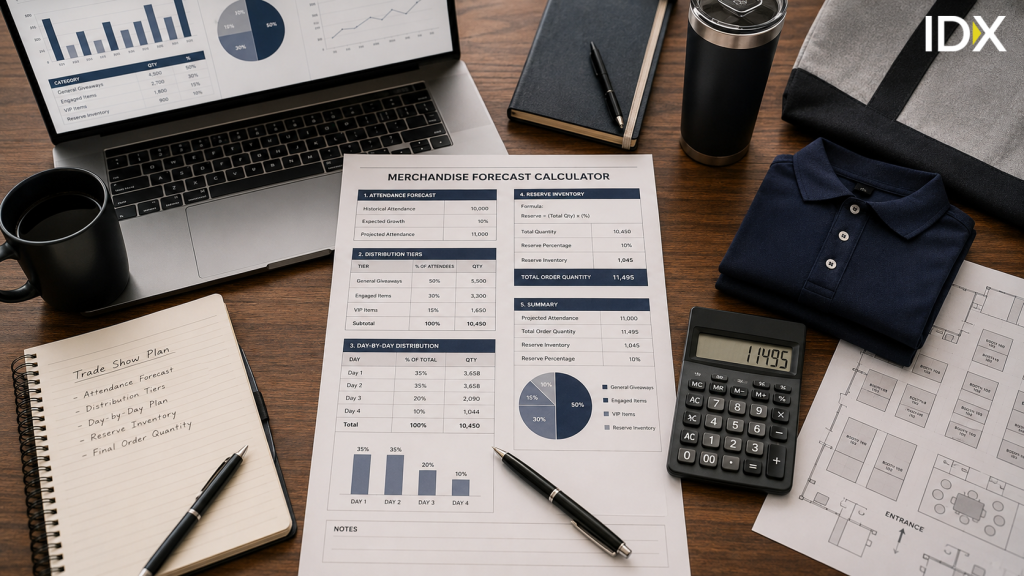
Altogether, this gives you a defensible, documented order quantity to bring to your budget conversation—not a gut feel.
Forecasting With No Historical Data
First-time exhibitors and brands entering a new show face a genuine challenge: no baseline to work from. Fortunately, here’s how to build a credible estimate from scratch.
Data Source 1: Show Organizer Media Kit
To start, most major trade shows publish attendee demographics, registration totals, and exhibitor traffic studies. Simply request this from your show contact.
Data Source 2: Peer Exhibitors
Next, look to brands in adjacent (non-competitive) categories who have attended the show previously; they’re often willing to share general benchmarks. LinkedIn is useful here.
Data Source 3: Industry Association Benchmarks
Similarly, EXHIBITOR Magazine and the Center for Exhibition Industry Research (CEIR) publish exhibitor performance data by industry vertical and show size.
Data Source 4: Your Sales Team’s Pipeline
Finally, the number of named accounts your team plans to meet at the show is your floor for VIP inventory. From there, build up.

When data is scarce, lean toward ordering slightly more than your model suggests for Tier 1 (general items), and slightly less for Tier 3 (VIP/premium). Since general items are less costly to absorb as excess, that’s the safer direction to round up. Premium items, on the other hand, have a higher per-unit cost and are better ordered conservatively, with the option to reorder for future shows.
For more in-depth information on this topic, read our full blog (COMING SOON).
Merchandise Ordering Checklist
Before submitting any merchandise order for a trade show, use this checklist:
Planning inputs:
- [ ] Total registered attendance confirmed with show organizer
- [ ] Booth size and floor position documented
- [ ] Traffic conversion rate for your booth type estimated (use benchmarks if no history)
- [ ] VIP named list finalized with sales team
- [ ] Non-booth distribution needs identified and quantified
Order structure:
- [ ] Three-tier distribution model applied
- [ ] Day-weight model reviewed for this specific show’s format
- [ ] 15% reserve buffer calculated and added
- [ ] VIP buffer (10–20% above named list) included
- [ ] Separate line items created for each tier (don’t blend)
Logistics:
- [ ] Order placed with sufficient lead time (minimum 4–6 weeks for custom items; 6–10 weeks for complex or overseas production)
- [ ] Shipping confirmation to show venue or advance warehouse documented
- [ ] Return shipping plan established before the show (not after)
- [ ] On-site inventory count system in place (daily counts prevent surprises)
Lead Time: The Variable That Breaks Everything
No forecasting model saves you if you order too late, since custom merchandise production timelines are frequently underestimated by first-time buyers.
Typical production lead times:
| Item Type | Standard Lead Time | Rush Lead Time |
|---|---|---|
| Branded pens, lanyards | 1–2 weeks | 5–7 days |
| Embroidered patches or caps | 3–4 weeks | 2 weeks |
| Custom enamel pins | 4–6 weeks | 2–3 weeks |
| Challenge coins | 4–6 weeks | 3 weeks |
| Custom apparel | 3–5 weeks | 2 weeks |
| Complex kits or packaging | 6–10 weeks | Not always available |
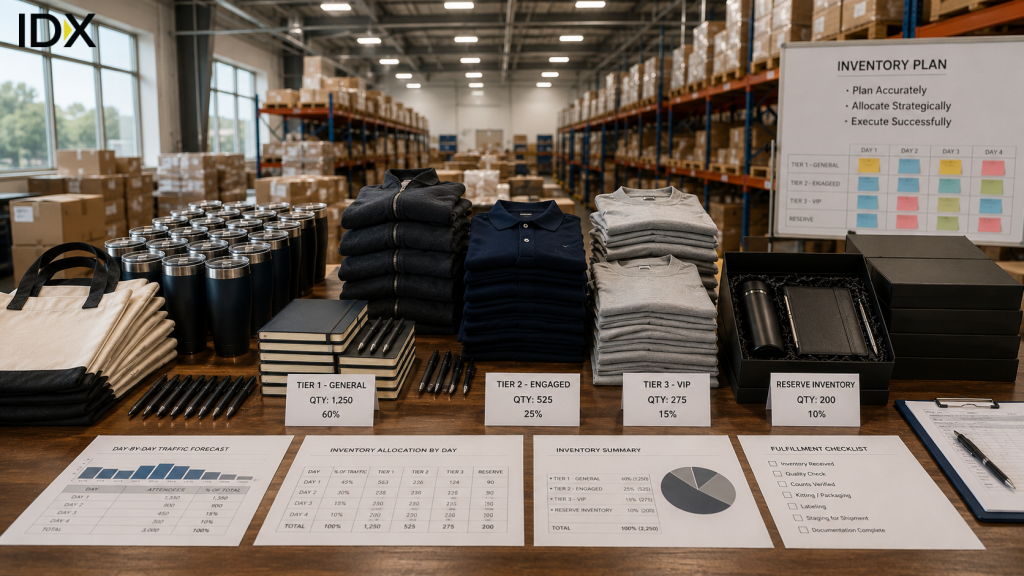
Rush production typically adds 20–40% to unit cost and isn’t always available for complex items. So, build your event calendar backward from your show date, and establish your merchandise order deadline first.
IDX works with clients on merchandise timelines as part of the full event planning process, catching ordering gaps before they become show-floor emergencies. Learn more about IDX event planning support.
Internal Links
- IDX Merchandise Planning Services—End-to-end support from quantity forecasting to on-site fulfillment.
- IDX Trade Show Booth Solutions—How booth design and merchandise strategy work together.
- IDX Event Infrastructure Planning—Logistics, lead times, and production management for event teams.
FAQ: How Much Merchandise to Order for a Trade Show
How much swag should I order for a trade show?
A practical starting point is to estimate 10–30% of total event attendance as your likely booth visitor count, then apply a three-tier distribution model across general visitors, engaged prospects, and VIP contacts. From there, add a 15% reserve buffer and account separately for non-booth distribution needs like sales follow-ups and executive gifts. Finally, always build in a minimum of 4–6 weeks of lead time for custom items.
How do I forecast event merchandise needs without historical data?
Use the show organizer’s media kit for attendance estimates, apply booth traffic conversion benchmarks by booth size (5–35% of total attendees depending on configuration), and consult your sales team’s named account pipeline for VIP quantity. Then, add a 15% buffer on top. Additionally, industry resources like CEIR publish exhibitor performance benchmarks by show type and vertical that can serve as useful reference points.
What percentage of trade show attendees visit a typical booth?
It varies significantly by booth size, position, and brand relevance. For example, small inline booths typically reach 5–10% of total attendees, while island and anchor sponsor booths can reach 30–50%. So, for planning purposes, use the midpoint of the range applicable to your configuration, then refine it after each show.
What is a VIP merchandise allocation?
A VIP allocation is a reserved quantity of higher-value merchandise designated exclusively for named prospects, existing customers, or executive-level contacts. Specifically, it should be calculated from a specific named list prepared with your sales team, not estimated as a percentage of general inventory. Typically, VIP lists run 25–150 people depending on show size.
What is a reserve buffer and how much should I add?
A reserve buffer is inventory held back from active distribution to cover unexpected traffic spikes, shipping damage, and non-booth needs. Generally, a standard reserve is 15% above your planned distribution quantity. However, for shows where you have no historical data, consider increasing this to 20%.
How far in advance should I order trade show merchandise?
For custom items, a minimum of 4–6 weeks before the show is the baseline, while complex items (kits, custom packaging, overseas production), require 6–10 weeks. That said, rush production is available from some suppliers, but it adds 20–40% to cost and may not be possible for all item types.
What is the biggest mistake marketers make when ordering trade show merchandise?
Using total event registration as the order quantity. Since registered attendees and actual booth visitors are not the same number, applying a booth traffic conversion rate to total registration, rather than ordering 1:1, is the single most common cause of both over-ordering and under-ordering, depending on which direction the assumption error goes.
Key Takeaway
Ultimately, the right answer to “how much merchandise should I order?” is not a number, it’s a process. Specifically, attendance estimates, distribution tiers, traffic patterns, VIP allocations, and reserve buffers each play a role. Ultimately, a documented forecasting model doesn’t just protect your budget; it makes you a more credible partner to your sales team, your leadership, and your show vendor.
IDX helps event marketing teams build that process from the ground up, so the answer is never another guess.